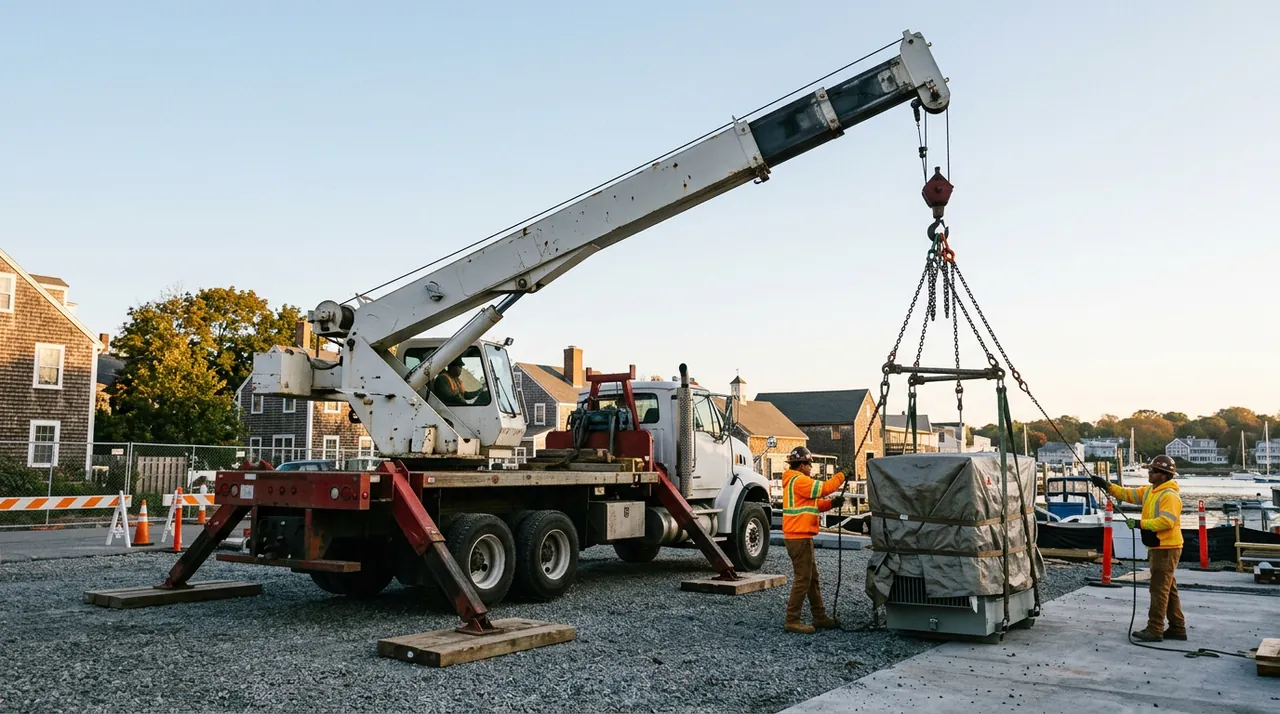
Before you swing a boom or pick a load, you have to answer one question: is this lift within the machine's rated capacity? The load chart answers that question, and reading it correctly is one of the most tested skills on the Massachusetts 1C exam. This lesson breaks the chart down piece by piece — what the numbers mean, how your setup choices affect them, and how to account for every pound of hardware between the hook and the load.
Anatomy of the load chart: rows, columns, and net capacity
A hydraulic boom crane load chart is a grid. Rows represent working radius — the horizontal distance from the center of rotation to the center of the suspended load. Columns represent boom length. You find rated capacity where your actual radius and actual boom length intersect.
That number is gross capacity. Net capacity — what you may actually put on the hook — is always less. To get there, subtract the combined weight of everything hanging from the crane that is not the load: the hook block, headache ball, slings, spreader bars, and any installed jib. That deduction can easily reach several hundred pounds on a typical boom truck, so do the math before you rig up.
How your setup changes every number on the chart
The capacity in any cell is only valid for one specific configuration. Change your setup and you must find a different cell — or a different chart page.
The two biggest variables are outrigger position and operating direction. A crane on fully extended outriggers carries significantly more than the same crane on partial outriggers or on rubber. If you set outriggers at partial extension, you must use the partial-extension column. Using full-extension numbers in that condition is a serious violation of the chart and a direct path to tip-over. Many charts also list different capacities over the front, side, and rear of the machine, because stability geometry differs by direction. Always match your actual setup to the correct chart configuration before reading any number.
The bold line: stability versus structural strength
Somewhere in the chart you will see a bold or shaded line running through the grid, called the stability line. The cells above it — shorter radii — are strength-limited: the boom structure sets the ceiling. The cells below it — longer radii, more extended boom — are stability-limited: the crane can structurally hold more than the chart says, but increasing the radius past that point means the tipping moment overtakes the restoring moment and the machine goes over.
In the stability-limited zone, your setup quality matters more than anywhere else. An unlevel position, soft ground, or a sudden swing brings you to the tipping edge faster than you might expect. That is also why measuring the loaded radius is critical: boom deflection under load increases radius, and you may have drifted into a less favorable cell without moving anything deliberately.
Dynamic loads and hard prohibitions
Load charts assume static conditions. Swinging with a load, stopping abruptly, or picking too fast all create dynamic forces that push the effective load beyond the rigging ticket weight. Wind has the same effect on any surface with area — a wall panel in a stiff breeze becomes a sail. Build in a margin rather than working at the printed limit whenever conditions are anything other than calm and deliberate.
Two things are never permitted regardless of the chart. Side-loading the boom — using it to drag or pull a load sideways — creates bending stress it was not designed to handle and can buckle a boom section without warning. And two-blocking, allowing the hook block to contact the sheave at the boom tip, can drop a load instantly. Rated-capacity indicators and anti-two-block devices are aids to the chart, not substitutes for it. The printed chart is the legal and safety limit, not a number to work up to.
Key Takeaways
- •Gross capacity minus rigging weight (hook, ball, slings, jib) equals net capacity — subtract it all before you pick.
- •Your setup must match the chart exactly: partial outriggers use partial-outrigger columns, and operating direction changes capacity.
- •The bold stability line separates strength-limited zones from stability-limited zones — in the stability zone, setup quality is critical.
- •Measure the loaded radius, not the unloaded radius — boom deflection under load increases radius and lowers rated capacity.
- •Side-loading the boom is prohibited; rated-capacity indicators are aids to the chart, never a replacement for it.